Are Owlbear Rodeo's Dice Fair?
We created a script to roll dice on Owlbear Rodeo for 24 hours, let's see what happened.

A recent post on the Owlbear Rodeo subreddit piqued my interest, in it they show that a player of theirs has been rolling very low using the built in dice roller for Owlbear Rodeo.
This got me thinking, is the dice roller in Owlbear Rodeo actually fair? We use a physics simulation to roll the dice but I've always wondered if this is able to provide us with true randomness. So to test this hypothesis I created a script to roll dice on Owlbear Rodeo for 24 hours, let's see what happened.
Methodology
In order to test the dice rolling I set up an empty room across four browsers: Opera, Safari, Firefox and Chrome.
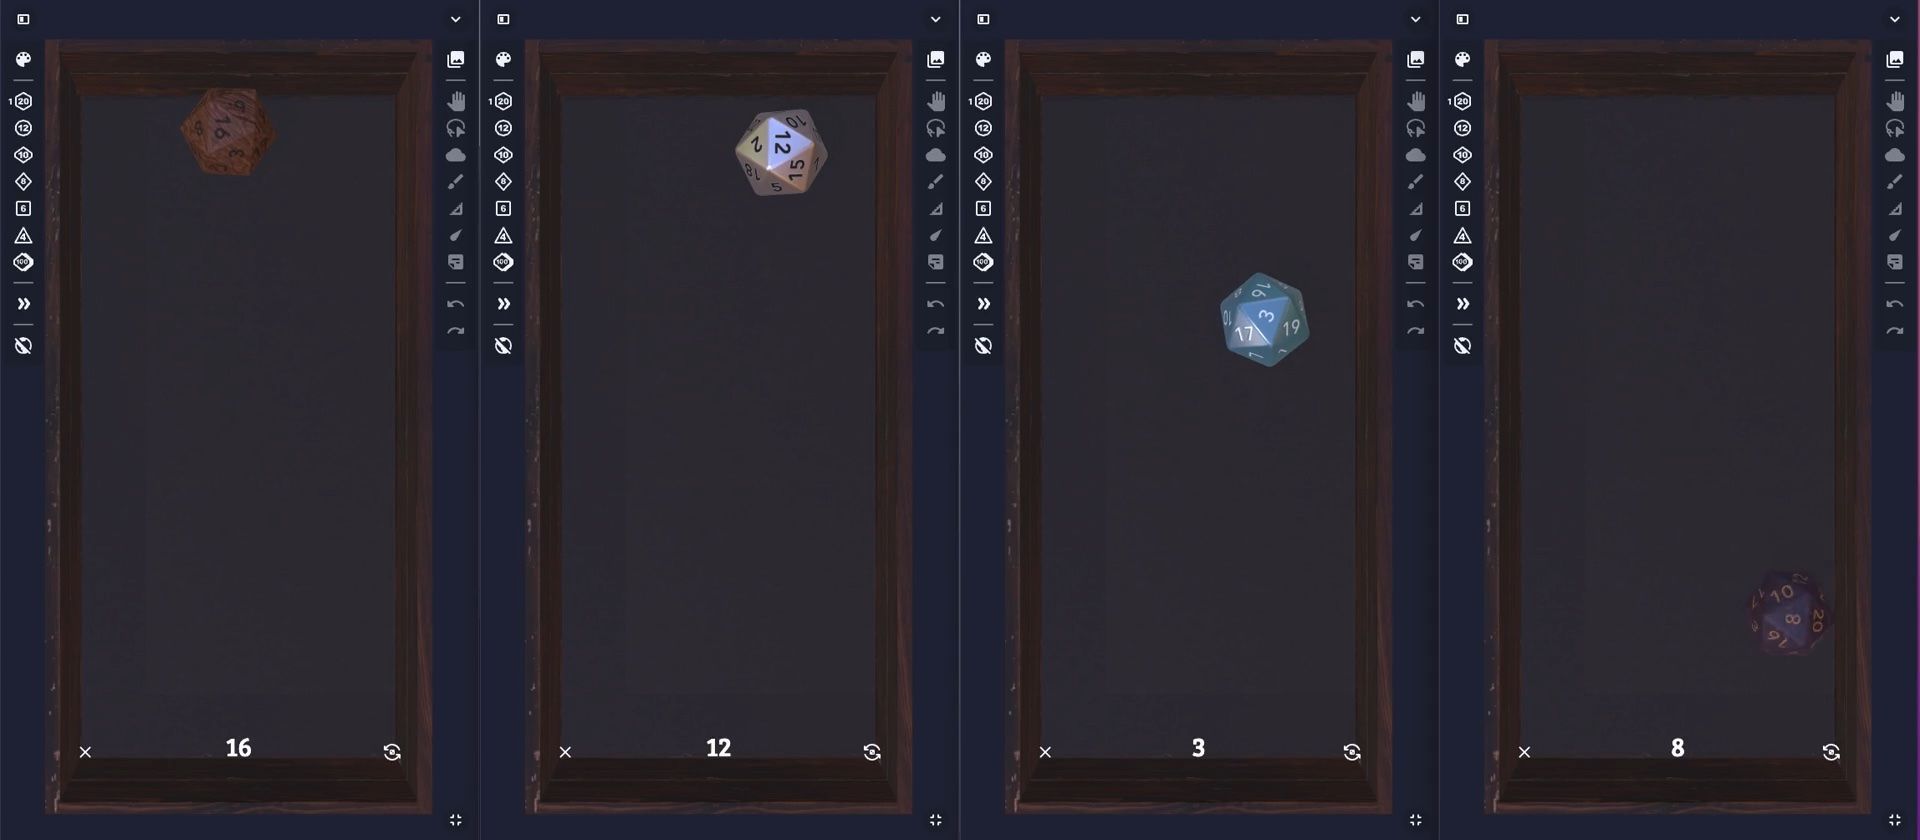
I then opened the dice roller and added a single D20 with the Galaxy material. I then wrote a script that clicks the reroll button every 5 seconds, this gives the dice enough time to roll in the dice tray then settle before checking the result. After 2000 dice rolls the script saves a text file that includes the result of every roll.
This script and all the results are provided at the bottom of this post so feel free to verify or find any bugs in this methodology.
Why did we choose 2000 rolls?
When starting out on this experiment I wondered what would be an appropriate sample size so that when we do our statistical analysis our results will be as accurate as possible.
Luckily I found this blog post by Delta, a D&D streamer and college lecturer in mathematics.
In it they explore the sample sizes needed to test whether a dice is balanced, they do this by generating a power curve that shows what happens when you shift the balance of a d20 so that one side appears more often than the rest.
Here are some results from that post.
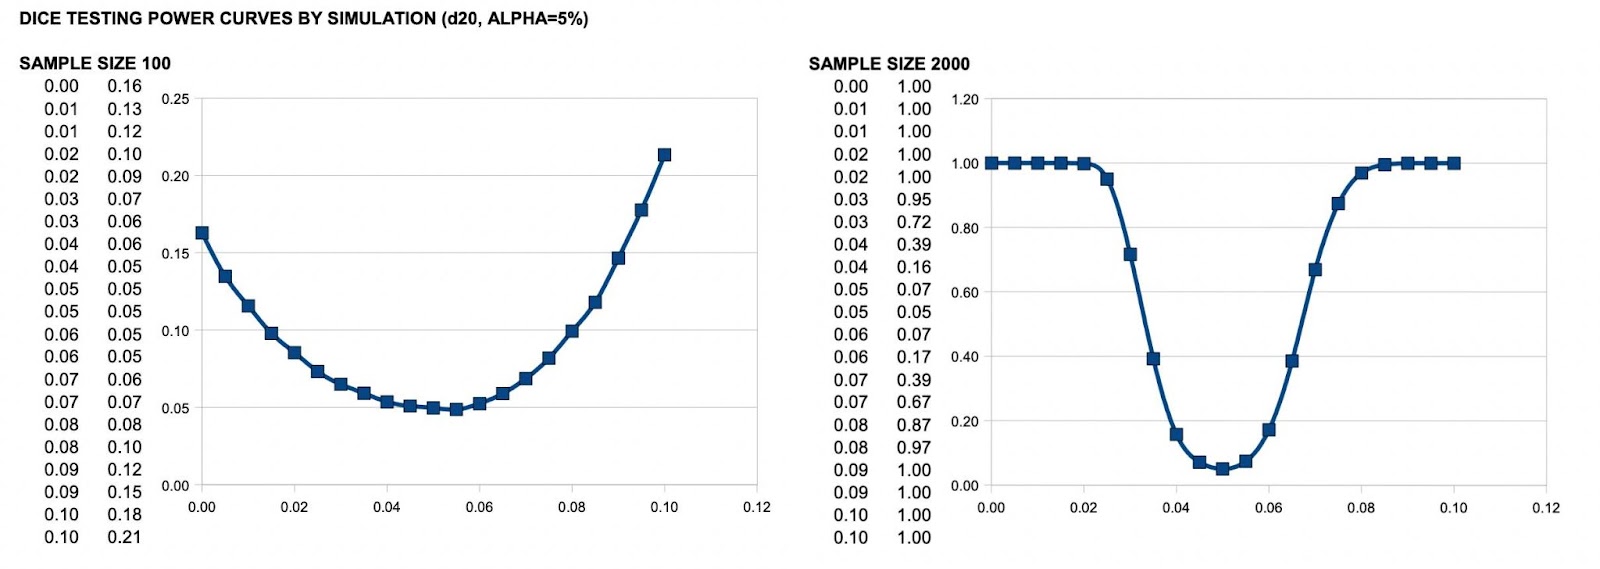
These graphs are a little complicated but I'll see if I can explain them.
On the left we rolled our unbalanced die 100 times and on the right 2000 times.
The x-axis of both graphs show us the probability that we see the unbalanced side of the dice when we roll. At x=0.05 there is a 5% chance we see this unbalanced side, this means we have a fair dice as all the sides have equal chance of showing up. At x=0 we have a 0% chance that our unbalanced side will show up, this effectively turns our d20 into a d19 (because we'll never see one of the sides).
The y-axis shows us the probability that our tests think our dice is unbalanced when it is actually fair.
With this in mind we can see that rolling 100 d20s means that only 16% of the time we will be able to tell the difference between a d20 and a d19 (when x equals 0 on the first graph).
This means that with 100 samples we have an 86% chance of thinking our dice is fair when it is actually not.
In order to get an unbiased result Delta recommends rolling at least 500 times, we decided to roll each dice 2000 times to be safe. As each roll takes 5 seconds each test took around 3 hours to run. To speed up the process we ran the four tests in parallel.
All tests were run on an M1 Mac Mini.
Results
After running the simulation here are the results across the four different browsers.
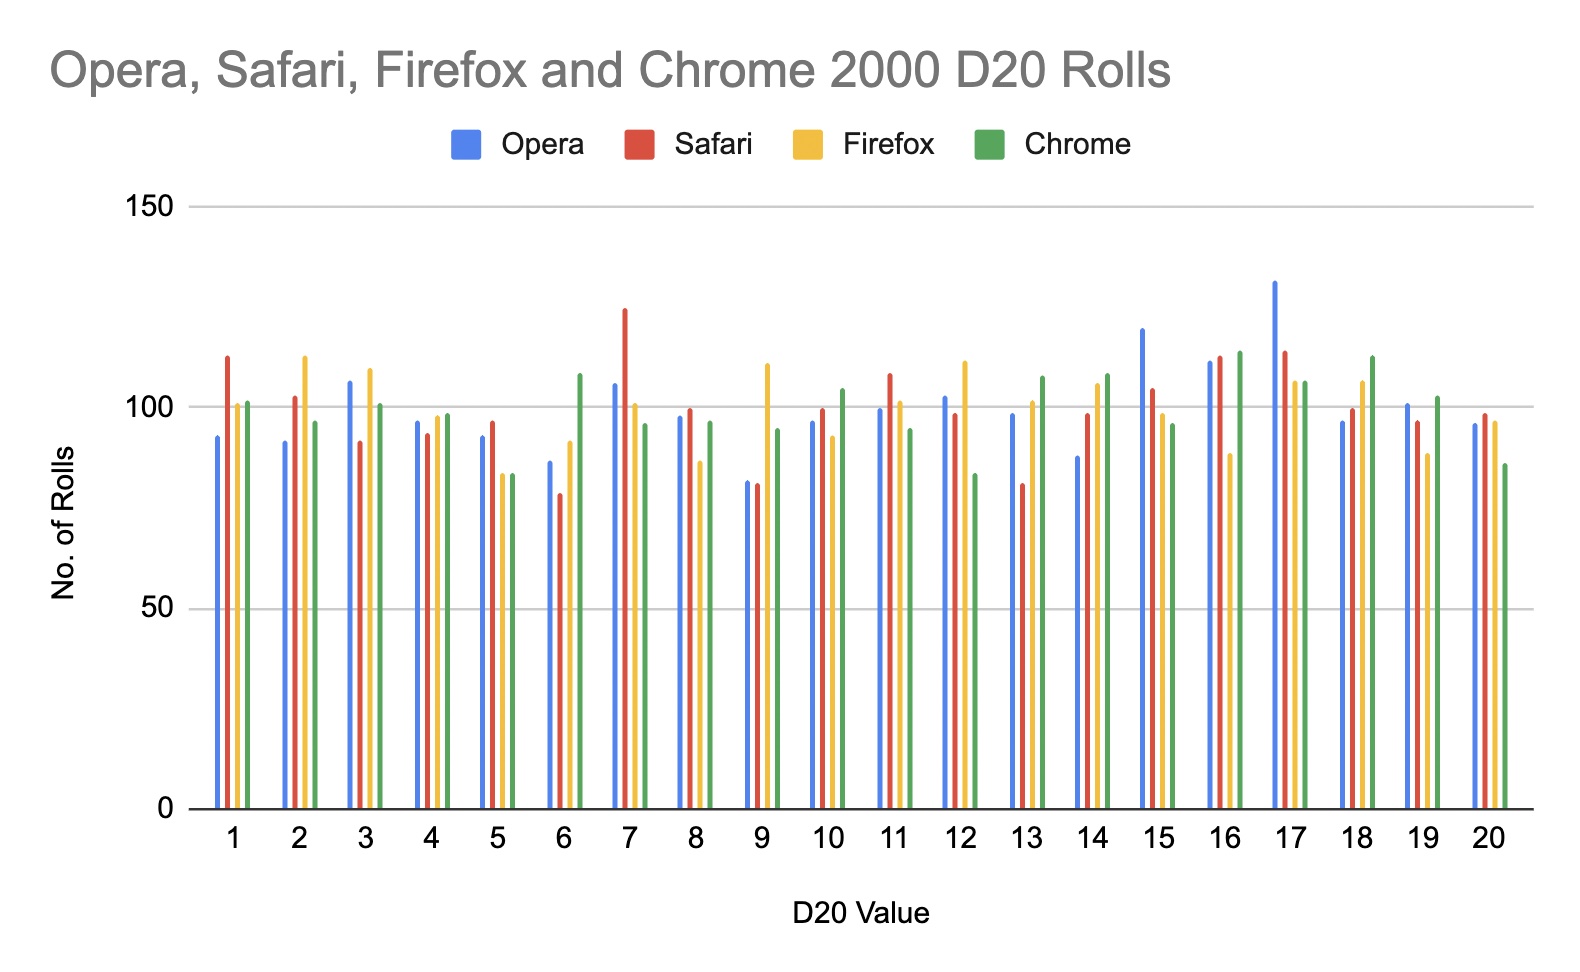
As we rolled the die 2000 times our expected frequency for each die value will be 100 (2000 / 20). Each browser gets close to this value (some are over and some are under) but does this mean our dice are unfair?
To answer this we will perform a Pearson's chi-squared test. This will tell us whether our dice really is fair and will help us determine how much our distribution differs from the theoretical best results.
To perform the test we will calculate the sum squared error of each roll versus the expected frequency. We can then use a significance level of 5% and look up on a chi-squared table the the value for a d20. This gives us a value of 30.14 which means if our chi-squared value for our dice rolls is above 30.14 our dice is not fair.
After calculating the chi-squared value for all our browser tests we end up with the following results.
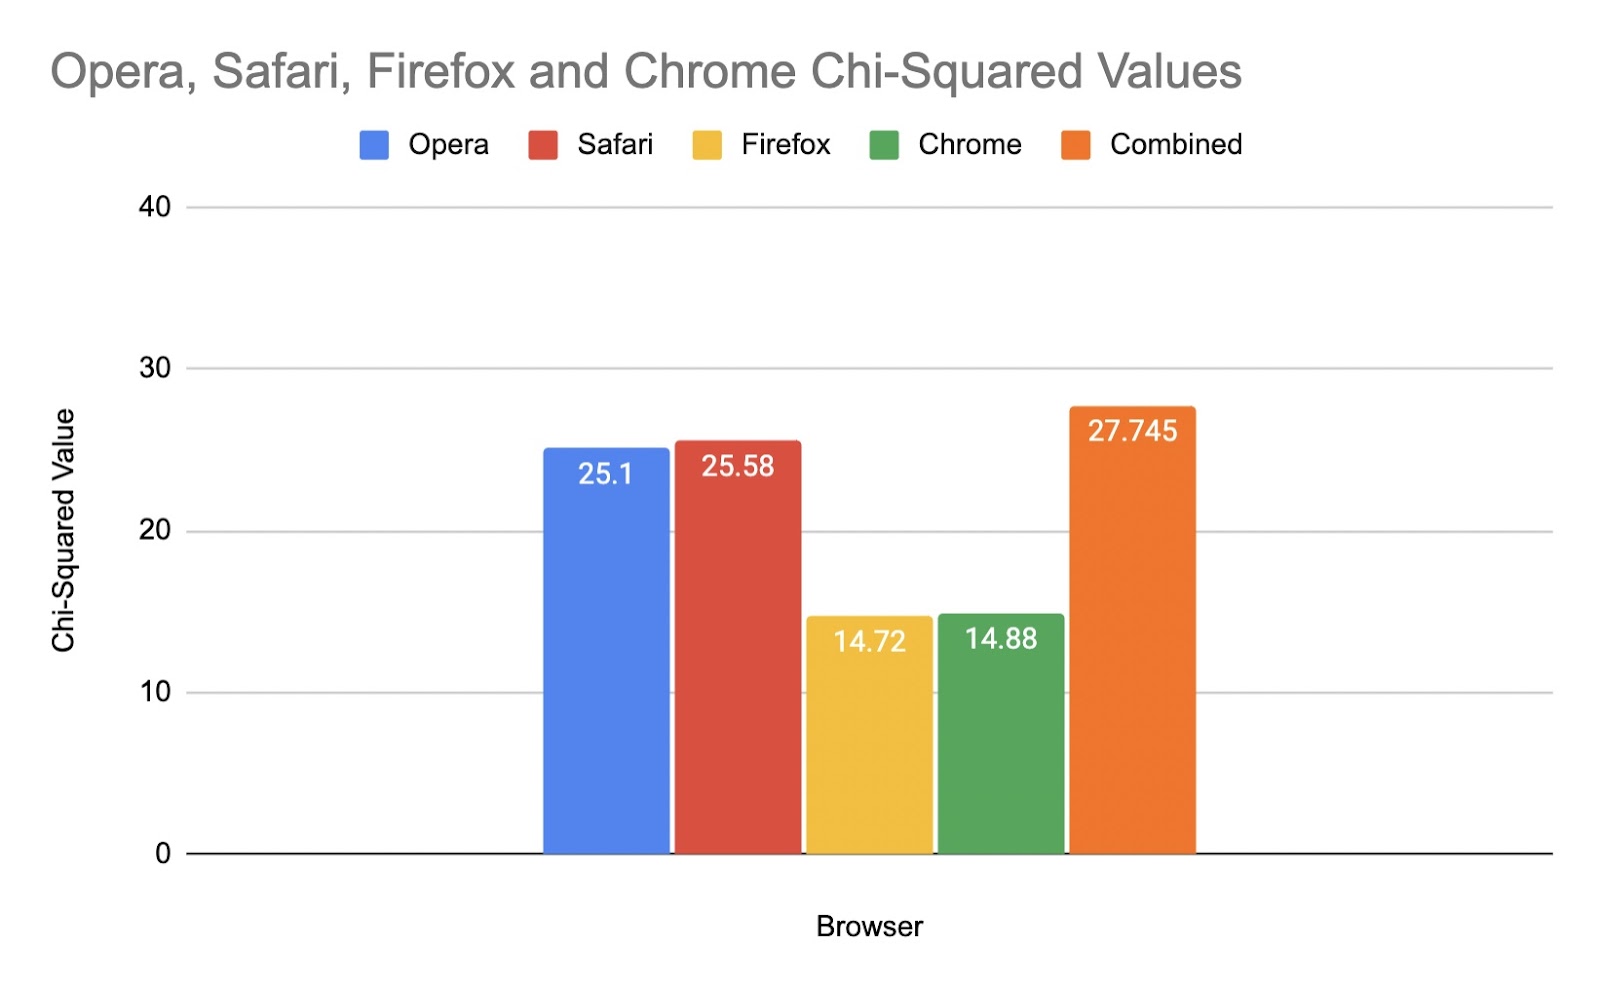
All our tests fall well below our 30.14 maximum which tells us that our dice are statistically fair. We also combined all the rolls from each browser into one test with 8000 total rolls which also falls below our threshold.
Interestingly both Chrome and Firefox performed better on this test compared to Opera or Safari but we didn't have time to run the test multiple times to see whether this is a pattern or a random occurrence.
Materials testing
The next test we ran was to compare the dice rolls between different materials.
A hidden feature of Owlbear Rodeo's dice roller is that different dice materials actually have different physical properties. For example the metal dice weigh more than the plastic dice and the wooden dice have sharper edges.
This means that changing dice materials will actually change how the dice are simulated.
To test whether any of these changes resulted in an unfair dice we ran the same test as before but instead of changing the browser we changed the dice material.
Here are the chi-squared results for the glass, metal, stone and wood materials.
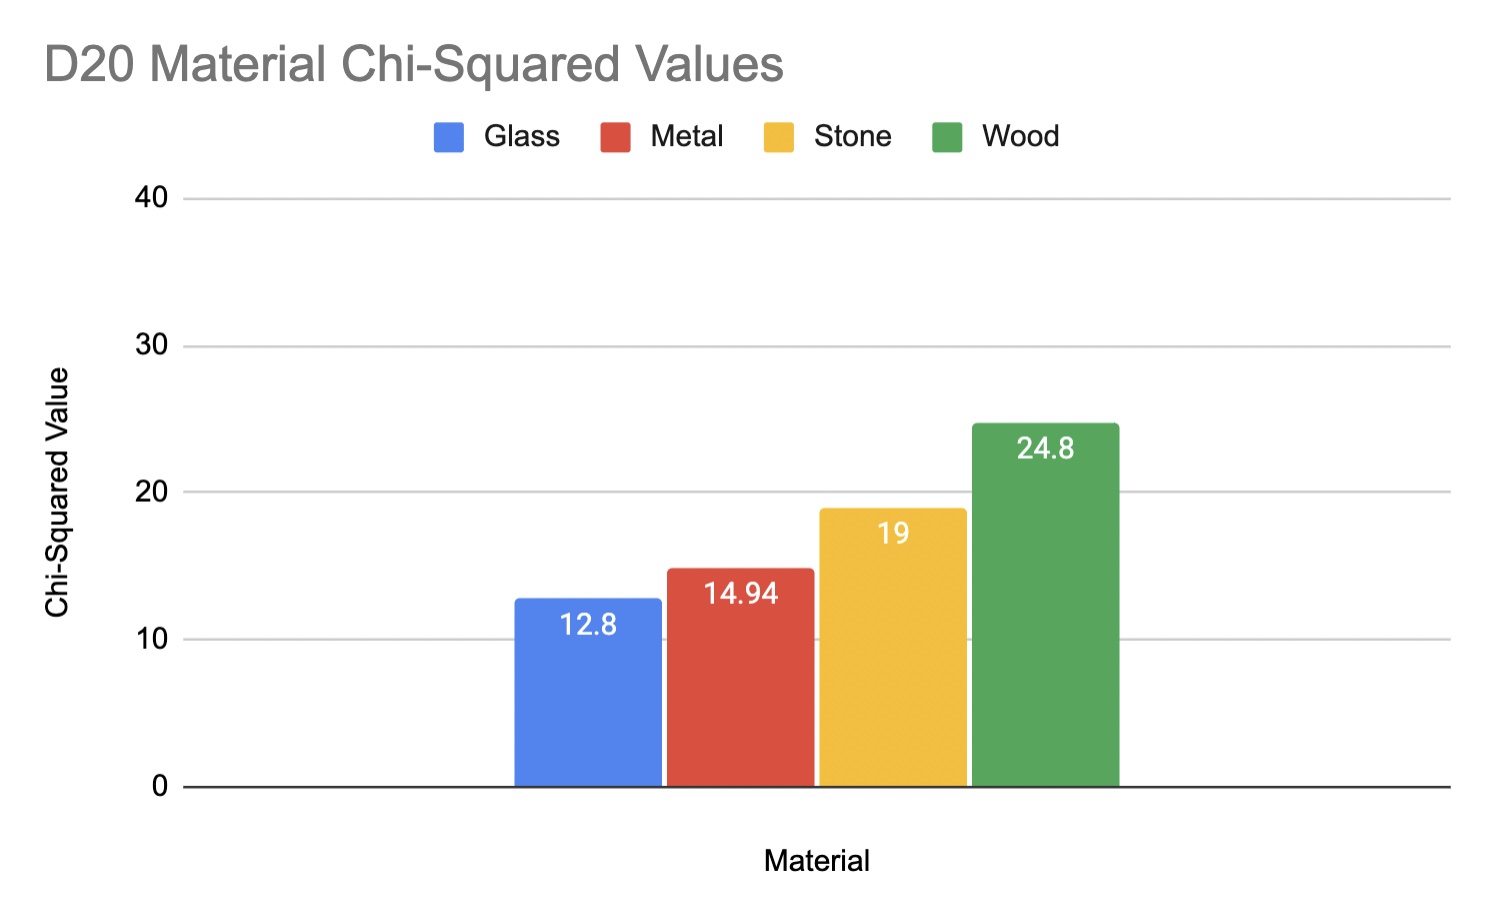
Again the tests fall under the 30.14 threshold for fairness, this shows us that changing dice materials doesn't have an appreciable effect on the balance of the dice.
Conclusion
We have proven that the dice in Owlbear Rodeo are statistically fair, of course this news probably doesn't help you on your third natural 1 in a row.
I wonder if in the future we should add a dice jail to banish the under performing d20s, at least then you can get some revenge on the dice gods that have forsaken you.
Anyway, this post is a little different from our usual so let me know if you enjoyed it.
On a final note my statistics could be a little rusty so if you find any errors in this post feel free to correct me.
The script to run the test and the raw data from the tests can be found here.